Investment Review
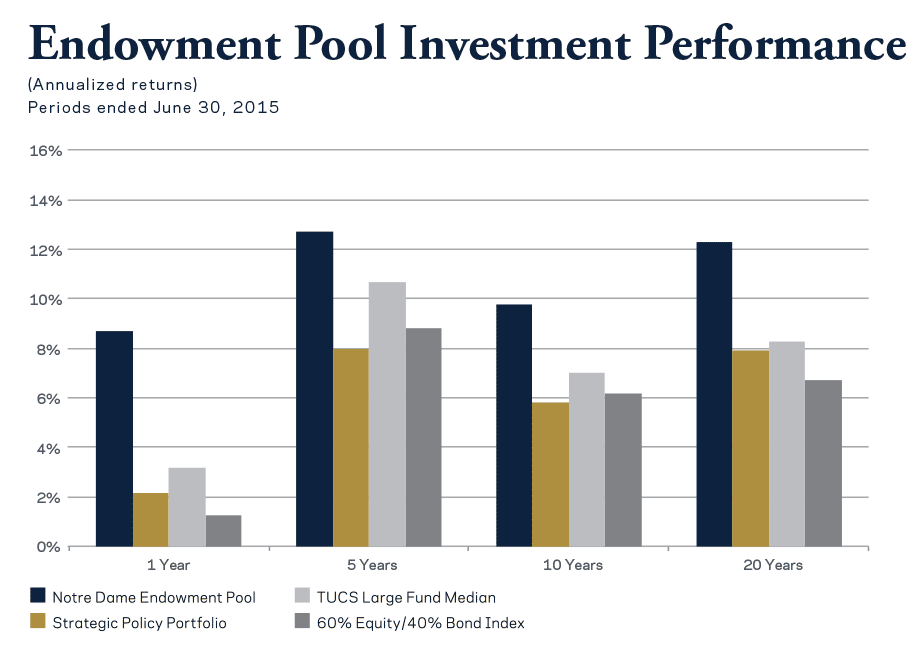
The Notre Dame Endowment Pool performed well in the fiscal year ended June 30, 2015, returning 8.7 percent net of investment management fees in a year during which the markets did not provide much reward for investors. As shown in the chart below, for example, a broad market index blend of 60 percent equities and 40 percent bonds returned only 1.3 percent.
 Notre Dame Endowment Pool returns are net of investment management fees. The Strategic Policy Portfolio (SPP) is Notre Dame’s internal benchmark consisting of indices representative of the target investment portfolio. The Trust Universe Comparison Service (TUCS) Large Fund Median is a compilation of returns of endowment, pension and foundation investors greater than $1 billion and thus provides a basis for comparison to the performance of large institutional investors generally. The 60/40 mix is an index blend of stocks/bonds as represented by the MSCI All Country World Investable Index and the Barclays Capital U.S. Aggregate Bond Index and thus is a measure of performance compared to a more traditional or retail portfolio.
“Endowments by their nature are intended to provide financial support in perpetuity and must be managed to achieve ‘intergenerational equity’…”
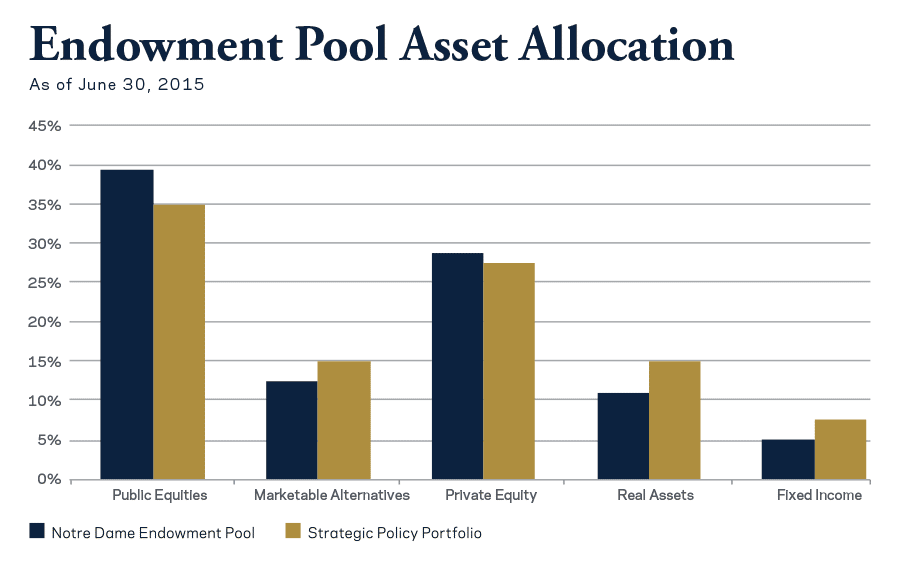
Led by the venture capital portfolio, private equity was the major contributor to returns and significantly outperformed public markets. Private equity also continued to be an important source of liquidity for the Endowment Pool, with distributions from prior investments notably outpacing capital calls for new investments. Public equities managers in certain emerging markets, and real estate, also provided strong returns. Asset allocation compared to the Strategic Policy Portfolio targets at the end of the fiscal year is shown below.

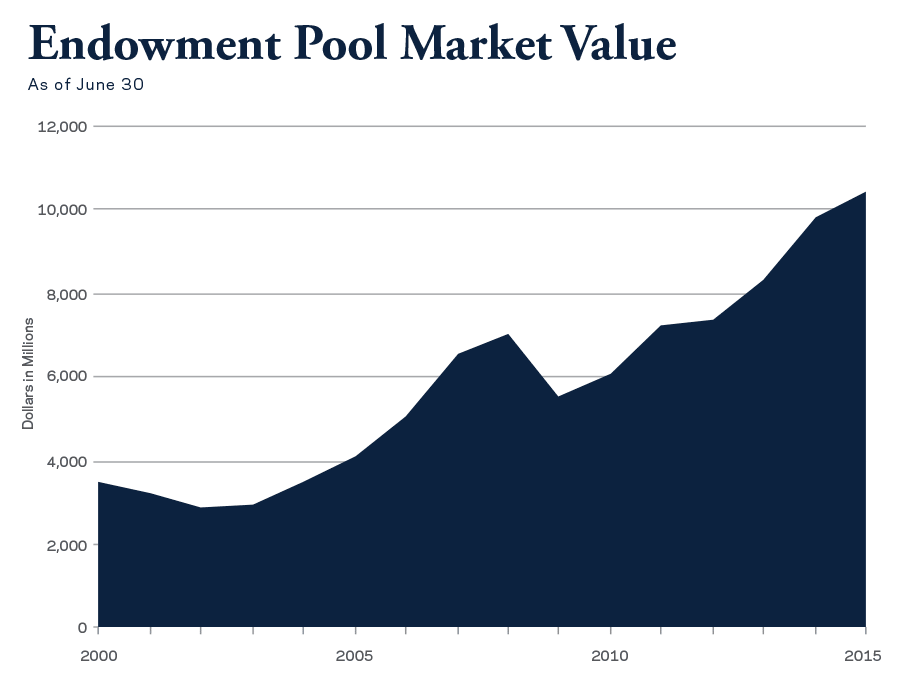
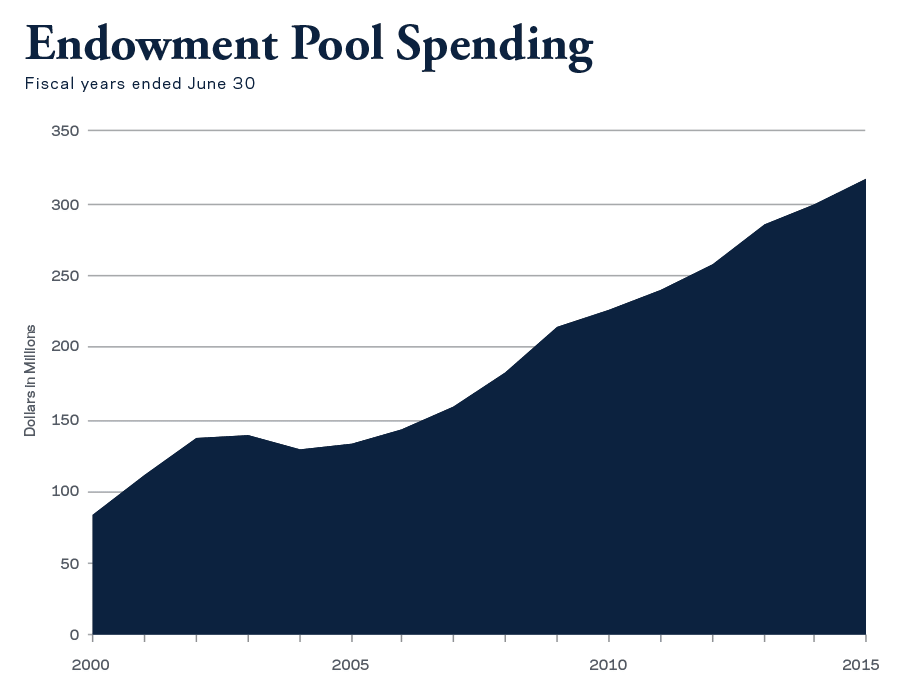
Endowments by their nature are intended to provide financial support in perpetuity and must be managed to achieve “intergenerational equity,” which requires balancing the needs of current students and faculty with those of future generations. So our focus, as always, remains on investment performance over longer-term periods (see the first chart above), as the effects of compounding provide an ongoing reliable source of funding crucial to the furtherance of Notre Dame’s mission. The market value of the Endowment Pool was $10.45 billion at the end of the fiscal year, and the two charts below show the tremendous growth in both market value and spending from the Endowment Pool in the new millennium. A prudent spending policy, also with a long-term focus, has allowed steady growth in the financial support provided by the Endowment Pool, even through the dramatic 2008 market downturn.


Spending from the Endowment Pool in fiscal 2015 was $317 million, a 5.8 percent increase over the prior year compared to the 3.7 percent increase in tuition. Endowment Pool spending funded 25 percent of the University’s expenditures during the year, with 32 percent of that spending going to student financial aid. Over the past 15 years, some $3 billion has been distributed from the Endowment Pool in furtherance of the University’s mission.
Scott C. Malpass
Vice President and Chief Investment Officer